The EU’s Industrial Strategy: Will Europe smile or will she not smile; that is the question
11.03.20
Introduction: how do we produce today?
In the 21st century, we have witnessed a profound change in how we manufacture products, both in general and in the innovative pharmaceutical industry: final products are made up of intermediate products that are both tangible (e.g. Active Pharmaceutical Ingredients or APIs, catalyst products) or intangibles (e.g. R&D, distribution, sales). Each of these can come from a different country and ultimately ends up in the final innovative medicine or treatment through a global value chain. This means that innovative medicines are essentially ‘Made in the World’ because of the global nature of the innovative pharmaceutical industry. It also means large innovators operate in multiple regulatory environments, they transport different stage intermediate goods across their value chains from country to country (and back) and – for each value chain part – look for comparative advantages in different countries. Yes, David Ricardo’s theory of comparative advantage is alive more than ever!
The Smiling curve
It is important to understand two elements related to global value chains (GVCs). First, the value-added that is created along the different stages of the value chain is not evenly distributed. The ‘smiling curve’ (Shih, 2012; Baldwin, 2016)[i] [ii] (Figure 1) shows that most value added is created in the most up- and downstream activities like in R&D, branding, marketing and sales parts of the supply chain and not in the production part. Some scholars argue that the smiling-curve has deepened over time (i.e. the ‘smile’ has become bigger), implying that the value-added gap between, for example, R&D activities and mere production has increased – and is still increasing – over time (as shown in Figure 1 when the GVC 1990s is compared to the GVC 2000s). Second, all activities in a value-chain are linked to each other. Production of medicines cannot exist without prior R&D. From the R&D stage, new medicines and treatments emerge that then need to be branded, produced and distributed in order to ensure access to them by patients.
Figure 1: Smiling curve: value-added along the value chain
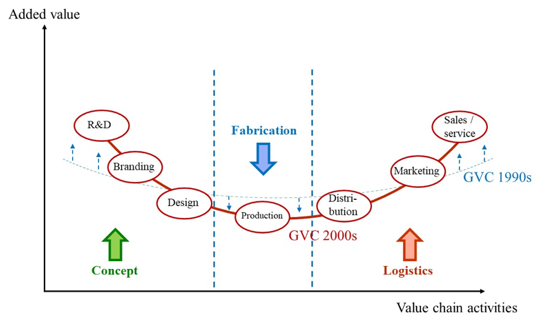
Source: Shih (1996)[iii], Dedrick and Kraemer (2010)[iv] and Baldwin (2011)[v]
Source: Shih (1996)[iii], Dedrick and Kraemer (2010)[iv] and Baldwin (2011)[v]
The innovative medicines industry and the EU economy
Statistics for the pharmaceutical industry further illustrate this value chain perspective and the value it brings to Europe. The European innovative pharmaceutical industry employs over 750,000 staff directly, 115,000 staff in R&D-related jobs and 2.5 million directly and indirectly across Europe (PwC, 2019)[vi].The industry is the most R&D intensive industrial sector in Europe (15.0% of net sales revenues are re-invested into R&D)[vii], invested €36.5 billion in 2018 into the EU economy, created €206 billion in gross value added overall and value-added of €156,000 per employee. So not only many but also high-quality jobs are being created. In addition, the pharmaceutical industry, with a trade surplus of €102 billion in 2018 is the largest contributor to the EU’s trade surplus of all industrial sectors.
Pharmaceutical industry specifics
Research in general, and research into innovative medicines and treatments in particular, can be characterized by being long-term, high-risk, and expensive. From the moment a molecule is patented, it may take up to 10 to 13 years before a medicine can be accessed by patients. This is due to the various steps – from pre-clinical research through three clinical trial phases – a potential medicine must go through in order to achieve final regulatory approval, after which pricing and reimbursement negotiations often add further delays in access. Innovative medicines innovation is also high-risk. It is estimated that only 1 or 2 out of 10.000 molecules make it into a final innovative medicine or treatment accessible to patients. So, one successful medicine has to earn back not only the R&D costs of the development of the medicine itself, but also the costs made for all other failed R&D attempts (9.998 out of 10.000) and compensate capital providers for the risk they have taken with their investments. These characteristics make developing new medicines and treatments expensive. DiMasi et al. (2016) estimate the cost of R&D for a new chemical or biological entity at € 1.9 billion in 2014[viii]. Understanding these characteristics is important when developing appropriate policies.
Europe’s competitiveness and attractiveness has been sliding compared to global competitors
Despite these impressive figures, the relative position of Europe has eroded over the past 30 years. In 1990, R&D investments in the EU amounted to €7.8 billion, the highest R&D investments of any region in the world. In 2017, while R&D investments had risen to €35.3 billion, US R&D investment growth has way outpaced Europe (800% growth versus 450% for the EU) – as shown in Figure 2. Moreover, Figure 2 is incomplete in that it does not show the fast rise of China in terms of R&D investments since 2015 – which would reduce the relative performance of Europe further.
Figure 2: R&D investment levels of the pharmaceutical industry by region
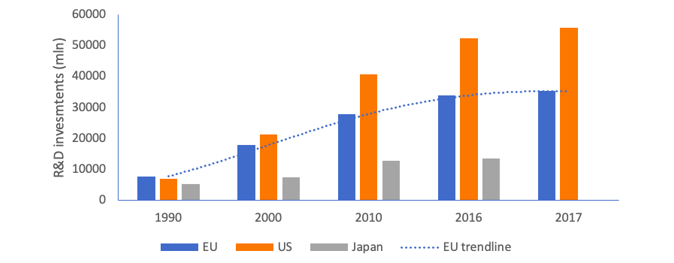
Source: Investment data from EFPIA, PhRMA and IFPMA member companies
Europe’s relative share of the global market in terms of sales is also falling as shown in Figure 3 (the size of the bubble is the size of the market in 2018). From 2014-2018 the Indian, Brazilian and Chinese markets grew by 11.2%, 10.8%, and 7.6% respectively compared to an average market growth of 4.7% for the Top-5 EU markets and 7.2% for the US (IQVIA, 2019)[ix]. For the 2019-2023 forecasted period, except for Japan, all other geographical areas are expected to see higher spending growth than the EU, further reducing Europe’s attractiveness in the current European Commission term.
Figure 3: Historic and forecasted spending growth by country
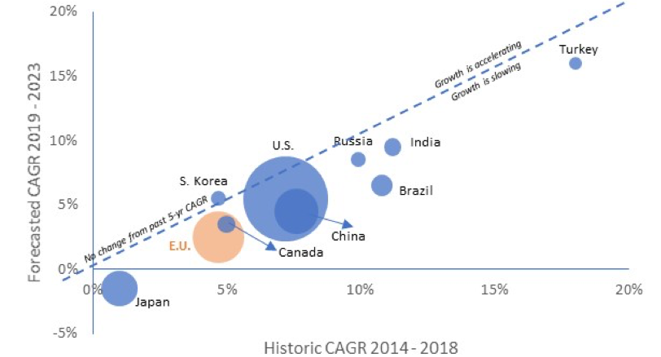
Source: IQVIA (2019)
Moreover, in 2018 North America accounted for 48.9% of world pharmaceutical sales compared to 23.2% for Europe. According to IQVIA (IQVIA, 2019), 65.2% of sales of new medicines launched during the 2013-2018 period were on the US market, compared to 17.7% on the European market (top 5 markets).[x]
Europe’s much needed industrial strategy
Assuming Europe wants to remain globally competitive in R&D for innovative medicines, at the high-value added end of the supply chain, it needs to continue to be an attractive environment for knowledge generation through research. An industrial strategy, supported by the appropriate trade strategy, provides a great opportunity in this regard. This strategy could ensure the EU economy will “continue to smile” or – alternatively – if it fails, see the smile grow in the US and China instead.
In designing the industrial strategy, it is imperative to acknowledge two issues.
First, the ‘assignment problem’ that each policy instrument should be assigned to the target on which it has the greatest relative effect, considering sector specific characteristics. This means that the EU’s industrial strategy has one core goal: industrial strategy, i.e. strengthening competitiveness of EU industries vis-à-vis global competitors – in line with WTO commitments (aligning with but not focusing on other policy objectives like sustainable development, free and fair trade or the green deal). For the EU’s supporting trade strategy this means the core goal is to promote free and fair trade, create market access for EU companies, and build a global level playing field based on high EU standards.
Second, the fact that no one stakeholder can create industrial competitiveness alone: only a competitiveness movement that involves all stakeholders can be successful. This involves all stakeholders that impact the four corners of Porter’s diamond: industry strategy, structure and rivalry, related and supporting industries, factor (input) conditions, and demand conditions (Porter, 1990)[xi]. This is shown in Figure 4. Stakeholders in the European healthcare space that determine the competitiveness of the innovative pharmaceutical industry from these four angles are the pharmaceutical industry itself, the patients, the European Commission, the European Parliament, the EU Member States, the regulators, the distributors, the pharmacists, the hospitals, and healthcare professionals.
Figure 4: Porter’s theory of national competitive advantage of industries (i.e. Porter’s diamond)
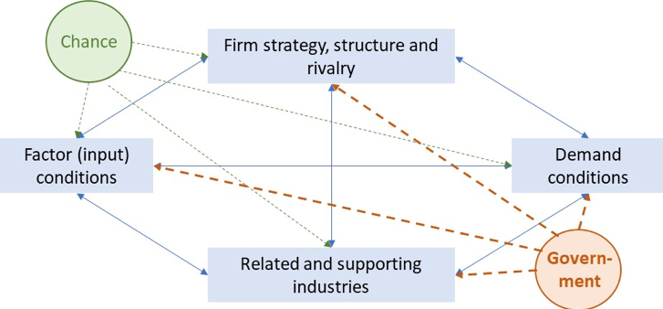
Source: Porter (1990)
From a competitiveness angle, Europe has the core capabilities present in the EU economy to build on (e.g. the EU has appropriate demand for innovative medicines for European patients or good factor conditions in an educated workforce). What the EU’s industrial policy can do is enhance the strengths already present in the EU economy and create a stronger and more innovation-friendly framework environment to support EU competitiveness, by including the following elements in the industrial strategy:
1. An IP framework that protects investment in medical research.
2. A regulatory framework that is stable, fast, effective and globally competitive.
3. Faster, more equitable access to new treatments for patients across Europe.
4. A research infrastructure that helps deliver the next generation of treatments.
1. An IP framework that protects investment in medical research
- Maintaining and developing Europe's world-class IP system by promoting strong IP protection, incentives and reward mechanisms for R&D in particular for orphan and paediatric medicines.
- Ensuring that the overall EU IP/ incentives framework remains globally competitive in order to attract investment into the development of future innovation for the benefit of patients.
- Identifying and implementing new incentives in areas of unmet medical need. For example, in the fight against antimicrobial resistance.
- Identifying appropriate incentives to ensure sustainable investment in new scientific developments such as Advanced Therapy Medicinal Products and personalized medicines.
- Increasing harmonization in the area of Supplementary Protection Certificates (SPC) and patent systems to increase transparency and certainty for all stakeholders.
- Implementing a smart trade strategy that promotes this world-class IP system and reward for R&D globally via IP and regulatory provisions in EU FTAs and creates market access and a level playing field based on high European standards for European companies.
- Using Real World Data (RWD) and Real World Evidence (RWE) in regulatory decision-making.
- Embracing innovative clinical trial approaches and the development of the associated IT infrastructure.
- Creating a dynamic regulatory assessment process allowing for more flexible EU regulatory pathways, including an iterative process for seeking early advice on data sets intended to be included in the marketing authorization application.
- Introducing a clear assessment pathway for drug/device combination products, including a streamlined pathway for a biomarker validation.
- Modernizing the variation framework (Delegated EU Regulation 1234/2008) to ensure its full alignment with risk-based principles and tools, inter alia embracing innovation by being adaptable to future developments.
- Promoting global regulatory convergence through the EU’s trade policy (e.g. MRAs on GMP inspections) and active participation in global forums such as ICH and PIC/S.
- In line with identified broad stakeholder need for creating competitiveness as per Porter’s diamond, creating a High-Level Forum on Better Access to Health Innovation to develop multi-stakeholder solutions to introducing new technologies into health systems and reduce the time patients in Europe wait for access to new treatments. Identifying, analyzing and addressing the reasons why patients in Europe do not get access to treatments or endure significant delays, then co-create solutions.
- Improving, understanding and intelligence of the root causes and drivers of shortages and implementing appropriate monitoring mechanisms involving all supply chain actors.
- Developing and implementing novel pricing and payment approaches to address the needs of patients, health systems and governments. These include combination-based pricing, indication-based pricing, outcomes-based payments, over-time payments and subscription payments.
- Evolving Health Technology Assessment to ensure effective harmonization of clinical data requirements and removal of duplicative assessments.
- Ensuring (more than) parity with the US and China in life science IP incentives to remain an attractive location for R&D investment and industrial development.
- Building an operational European Health Data Space with clear rules of engagement for private and public parties.
- Developing clinical trials networks and sites, bio-banks and data banks of appropriate quality to support generation of data suitable for regulatory purposes.
- Delivering Public-Private-Partnership (PPP) mechanisms to balance health imperatives and scientific advances with translational drive and solid industrial processes which will accelerate bringing health solutions to patients.
If the EU manages to bring the different stakeholders that drive Europe’s competitiveness, together. If the EU executes an industrial policy that strengthens the European framework for innovation (via IP, regulatory, access and research infrastructure policies). And if the EU executes a smart trade agenda that extends this pro-innovation EU vision globally through trade policy. The EU economy will continue to smile 😊, and EU patients will ultimately benefit. Otherwise, the EU’s global position will erode further, and smiles occur elsewhere in the world...
[i] Shin, S., Kraemer, K.L., Dedrick, J. (2012). Value Capture in the Global Electronics Industry: Empirical Evidence for the “Smiling Curve” Concept. Industry and Innovation, 19(2), 89-107.
[ii] Baldwin, R. (2016). The Great Convergence: Information Technology and the New Globalization. Belknap Press, 2016.
[iii] Shih,S.(1996).Me too is not my style: Challenge difficulties, breakthrough, bottlenecks, create values (Taipei: The Acer Foundation).
[iv] Dedrick, J., Kraemer, K.L., Linden, G. (2010). Who Profits from Innovation in Global Value Chains?: A Study of the iPod and Notebook PCs. Industrial and Corporate Change, 19 (1): 81-116.
[v] Baldwin, R. (2011). Trade and Industrialisation after Globalisation’s 2nd Unbundling: How Building and Joining a Supply Chain are Different and Why it Matters. NBER Working Papers, 17716.
[vi] PriceWaterhouseCoopers (2019). Economic and societal footprint of the Pharmaceutical Industry in Europe, 2019.
[vii] 2018 EU Industrial R&D Investment Scoreboard, European Commission, JRC/DG RTD.
[viii] DiMasi et al. (Journal of Health Economics), 2016.
[ix] IQVIA (2019). The Global Use of Medicine in 2019 and Outlook to 2023. Forecasts and Areas to Watch. IQVIA, January 2019.
[x] IQVIA Midas data (2019).
[xi] Porter, M. (1990). The Competitive Advantage of Nations. New York : Free Press, 1990.